
The Grid
Types of Generation, The Merit Order, Transmission, Interconnection, Capacity vs Spot, PJM, ERCOT, IPP Stocks, Problems with the Grid, Two Solutions to Overflow Demand & Stock Picks

Hello again friends. I must apologize profusely as I skipped my duties of covering energy/power semi/800VDC to take a trip to neocloud land. Today we are back on track with the plan. We will start with the grid (and a grid-related idea), then move to powering the datacenter (and an 800VDC related idea), and finish with power semi (and more Aixtron content of course).
Welcome to The Grid.

By accessing this content, you acknowledge and agree to our terms and conditions. This research is not financial advice.
Contents
Types of Generation
The Merit Order
Transmission
Interconnection
Capacity vs Spot
PJM
ERCOT
IPP Stocks
Problems With the Grid
Two Solutions to Overflow Demand (with Stock Picks)
Types of Generation
There are a few ways to make electrons.
Nuclear splits atoms to generate heat, which creates steam, which spins a turbine. The fuel is cheap, the output is enormous, and the plants run 24/7 for 18-24 months between refueling. The catch: they cost $10-15 billion to build and take over a decade to permit and construct. Nobody is building new ones at scale in the US. Vogtle Unit 4, the last completed plant, came online in 2024 after years of delays and billions in overruns.
Coal burns carbon to make steam. Same turbine, same idea, much cheaper to build than nuclear. But coal plants are retiring across the country due to emissions regulations and unfavorable economics against natural gas. PJM lost significant coal capacity over the past decade, and those retirements are part of the supply squeeze we’ll cover later.
Natural gas is the workhorse of the modern grid and comes in three flavors. Combined-cycle gas turbines (CCGTs) burn gas to spin a turbine, then capture the waste heat to spin a second one. They run at 55-65% efficiency and serve as the default new-build for baseload. Simple-cycle turbines burn gas once, run at 30-40% efficiency, and exist for speed: they can ramp from cold to full output in 10-20 minutes. Peakers are the extreme version. They sit idle for thousands of hours per year and only fire when the grid is desperate.
Solar converts photons directly to electricity with no moving parts. Zero marginal cost when the sun shines. The problem is obvious: it doesn’t shine at night, and output varies with clouds and seasons. Wind uses air currents to spin turbines. Similar economics (zero fuel cost, variable output) but a different intermittency profile.
Hydroelectric uses falling water. Reliable, dispatchable, zero fuel cost. Also almost fully built out in the US. There are no new rivers to dam.
The key insight: each generation type has a fundamentally different cost structure. Nuclear and coal have high fixed costs and near-zero marginal costs. Gas has moderate fixed costs and fuel-dependent marginal costs. Renewables have high fixed costs, zero marginal costs, but variable availability. This cost structure determines the dispatch order.
The Merit Order
Power demand fluctuates. Not all generation is needed all the time!
To determine who generates power when, the grid stacks generation sources in order of marginal cost; a concept called the merit order.
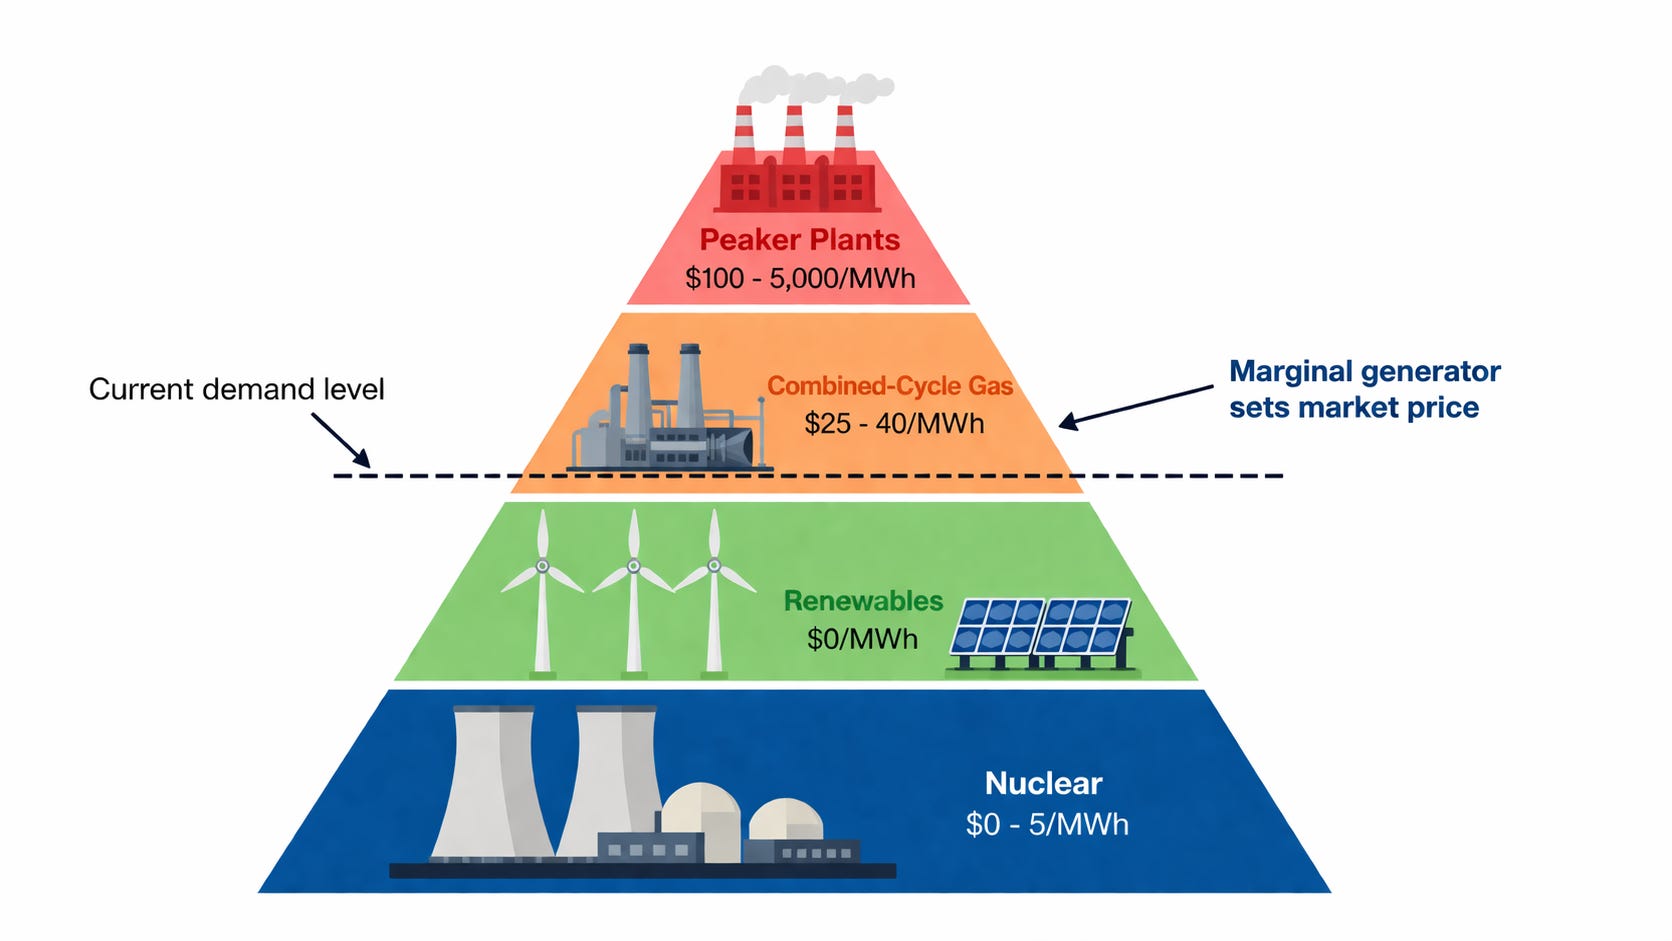
At the bottom sits nuclear. Always running, always cheapest per marginal MWh. Grid operators dispatch nuclear first because turning it off costs more than keeping it on.
Next come renewables. When the sun shines or wind blows, their marginal cost is effectively zero. They get dispatched whenever available, pushing other sources off the stack.
Then coal and combined-cycle gas. These form the bulk of daily generation. Coal’s marginal cost is its fuel, which has been consistently more expensive than gas in recent years. CCGTs are the flexible middle of the stack.
At the top: simple-cycle gas and peakers. Expensive per MWh, but they start fast. The grid only calls on them during peak demand. Brutally hot summer afternoons, freezing winter mornings, or unexpected generation failures.
The marginal generator (the last plant dispatched to meet demand) sets the price for the entire market in that hour. When demand is low, a CCGT sets the price at $25-40/MWh. When demand spikes, a peaker sets it at $100+ or even $5,000/MWh in extreme cases.
This dispatch hierarchy is the foundation of every energy market in the country. It explains why the same grid can produce $20 power on a mild Tuesday and $1,800 power during a winter storm.
Transmission
Generation is useless without delivery. The transmission system is the high-voltage backbone that moves electricity from power plants to population centers.
Power plants generate at relatively low voltage (11-35 kV), which gets stepped up to 115-765 kV for long-distance travel. Higher voltage means lower current for the same power, which means less energy lost as heat in the wires. At the other end, substations step voltage back down for local distribution.
Transmission lines lose roughly 5-7% of the energy they carry over long distances. That number matters. A solar farm in West Texas producing cheap power is only useful if there are enough transmission lines to carry it to Dallas or Houston. When lines are full (congested), cheap power in one region can’t reach expensive demand in another.
This creates locational marginal pricing (LMP). The same MWh of electricity can cost $20 in one part of the grid and $200 a hundred miles away, simply because the wires between them are at capacity. LMPs are the real-time manifestation of transmission constraints, and they matter enormously for datacenter siting decisions.
Building new transmission takes 7-12 years in most jurisdictions. Permitting, right-of-way acquisition, environmental review, and construction all stack up. You can’t build enough transmission to serve AI demand on AI demand’s timeline.
Interconnection
If transmission is the highway, interconnection is the on-ramp. Every new generation source or large load (like a datacenter) that wants to connect to the grid must go through an interconnection study process.
The process has three phases in most markets. First, a feasibility study determines whether the grid can physically handle the new connection. Second, a system impact study models how the new connection affects power flows across the wider grid. Third, a facilities study identifies exactly what upgrades (new transformers, switches, line extensions) are needed and what they’ll cost.
The interconnecting party pays for network upgrades. A datacenter wanting 500 MW of grid power might need $200 million in substation and transmission upgrades, with a 4-5 year construction timeline, before a single server can draw power.
PJM’s interconnection queue had over 2,500 projects totaling hundreds of GW waiting as of late 2025. The average time from application to completion exceeded four years. Many projects in the queue are speculative (developers filing applications for sites they may never build), which clogs the process for legitimate projects behind them.
This is the single biggest bottleneck for AI datacenter buildout. A hyperscaler can sign a lease, order GPUs, and break ground on a shell in months. Getting grid power delivered to that site takes years. The disconnect between the speed of AI demand and the speed of grid interconnection is the central tension in the power market today.
Capacity vs Spot Markets
Electricity markets split into two distinct mechanisms.
Spot markets trade actual electricity in real time (or day-ahead). Generators bid to supply MWh at a price, demand is forecasted, and the market clears at the marginal bid. This is the spot market. Prices move with fuel costs, weather, outages, and demand. A generator makes money by producing and selling electrons.
Capacity markets are completely different. They trade the promise to be available. A generator that clears a capacity auction gets paid a fixed amount ($/MW-day) to maintain its ability to produce power when called upon. The generator might sit idle 95% of the year and still collect capacity payments.
The logic behind capacity markets: some power plants only run a few hours per year during extreme peaks. If those plants can’t cover their fixed costs from energy market revenue alone, they’ll shut down. Without them, the grid lacks the reserves needed during heat waves or cold snaps. Capacity payments are supposed to keep those plants in business.
PJM has both spot and capacity markets. ERCOT has only an energy market. This single structural difference drives a massive divergence in outcomes, prices, and incentives. It is the most important distinction in the entire US power landscape for understanding what comes next.
PJM
My opinion on PJM is not very high. If PJM and ERCOT were companies, they would make the perfect pair trade. Well maybe you can pair trade them with the IPP names…
PJM operates the grid across 13 eastern US states, serving 67 million people. It hosts Northern Virginia (the world’s largest datacenter hub), and major hyperscaler campuses from Google, Anthropic, Amazon, and Meta.
If you ever hear about capacity auctions hitting price caps think PJM.
In the 2024/25 delivery period, capacity cost $29/MW-day. In the 2025/26 delivery period, it jumped to $270/MW-day. That is a 9.3X INCREASE in a single year. Some locations hit $450/MW-day. The subsequent 2026/27 and 2027/28 auctions both cleared at the federal price cap of $329/MW-day, because regulators imposed a ceiling after the initial shock.
Total capacity payments: roughly $16 billion annually, or about $120,000 per MW. For the average PJM household consuming 880 kWh/month, that translates to approximately $30 per month in additional costs.
Now obviously this is unsustainable and became a reason people blamed data centers for increased power prices.
The simulation problem
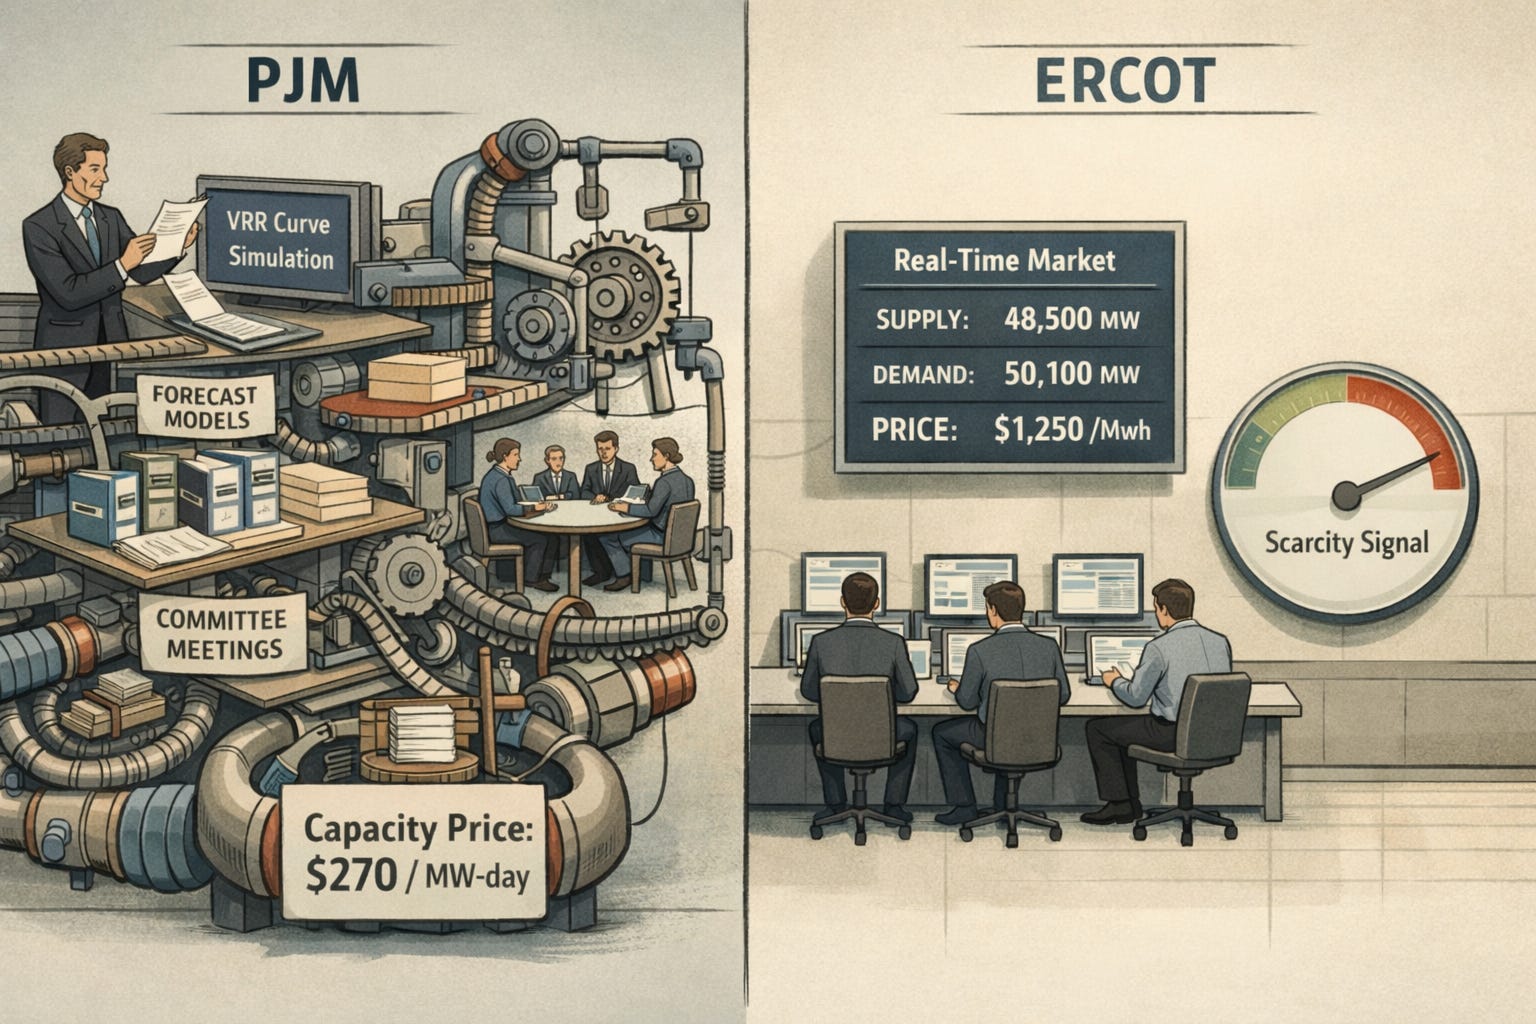
Capacity prices in PJM aren’t set by market participants bidding against each other in the traditional sense. They’re driven by a simulated supply-demand curve called the Variable Resource Requirement (VRR) curve. PJM builds this curve from its own internal demand and supply forecasts, using non-public models and proprietary data. The VRR curve’s shape near the clearing point determines whether capacity costs $29 or $270.
So intuitively speaking, in normal markets price is set by the market clearing of supply and demand. In PJM land they decide the price for you. Any solid scholar of economic history can probably guess how this turned out…
PJM cannot forecast datacenter load. Their own data proves this. In 2024, they cut their datacenter load forecast by 800 MW versus the prior year. In 2025, they cut it again by 1.1 GW. Two consecutive years of massive downward revisions from a central planner responsible for a $16 billion annual market.
The simulation itself converts a moderate demand increase into a 9.3x price explosion. They drastically over-forecast how much load hits the market.
Forward traders also disagree with the energy benchmark increased 12-20% in the 2028-2030 window, nothing close to 9.3x.
ERCOT
ERCOT harnesses THE POWER OF MARKETS!
The Electric Reliability Council of Texas (ERCOT) runs the Texas grid. Same AI buildout (OpenAI, Google DeepMind, Anthropic are all building massive facilities). Completely different market structure.
ERCOT has no capacity auction. No BRA. No VRR curve. No central planner simulating supply and demand to set capacity payments. Instead, it uses an energy-only market with real-time scarcity pricing via an Operating Reserve Demand Curve (ORDC).
When supply-demand balance gets tight, real-time prices spike from the normal $10-50/MWh to as high as $5,000/MWh, with additional transmission congestion adders. Gas peakers and batteries that run fewer than 100 hours per year can still pay for themselves because those hours are worth millions of dollars.
The incentive structure is fundamentally different. In PJM, generators get paid whether they perform or not. In ERCOT, generators only make real money when the grid actually needs them and they deliver.
Stable prices despite massive demand growth
ERCOT’s 2025 Long-Term Load Forecast projected 77.9 GW of potential datacenter load by 2030, more than double the prior year’s projection. However, ERCOT’s demand forecasts do not directly drive prices.
Forward prices in ERCOT have only increased 11-17% in the past year!
Winter Storm Fern
The January 2026 freeze was the real-world stress test.
ERCOT’s grid held. The Weather Watch remained precautionary. Demand ran below forecasts. No emergency procedures triggered. Real-time prices peaked around $300/MWh. Post-Uri winterization reforms proved effective under real conditions.
PJM paid $270/MW-day in capacity costs and lost 21 GW of generation. Fifteen percent of the cleared fleet went offline due to frozen equipment and fuel delivery failures. The Department of Energy issued emergency orders under Section 202(c) of the Federal Power Act, authorizing bypass of environmental limits and access to roughly 35 GW of backup generation (including datacenter and industrial backup power that would have been ineligible for the BRA). System-wide average prices hit $700/MWh. Virginia’s datacenter-heavy Dominion zone spiked to $1,800/MWh.
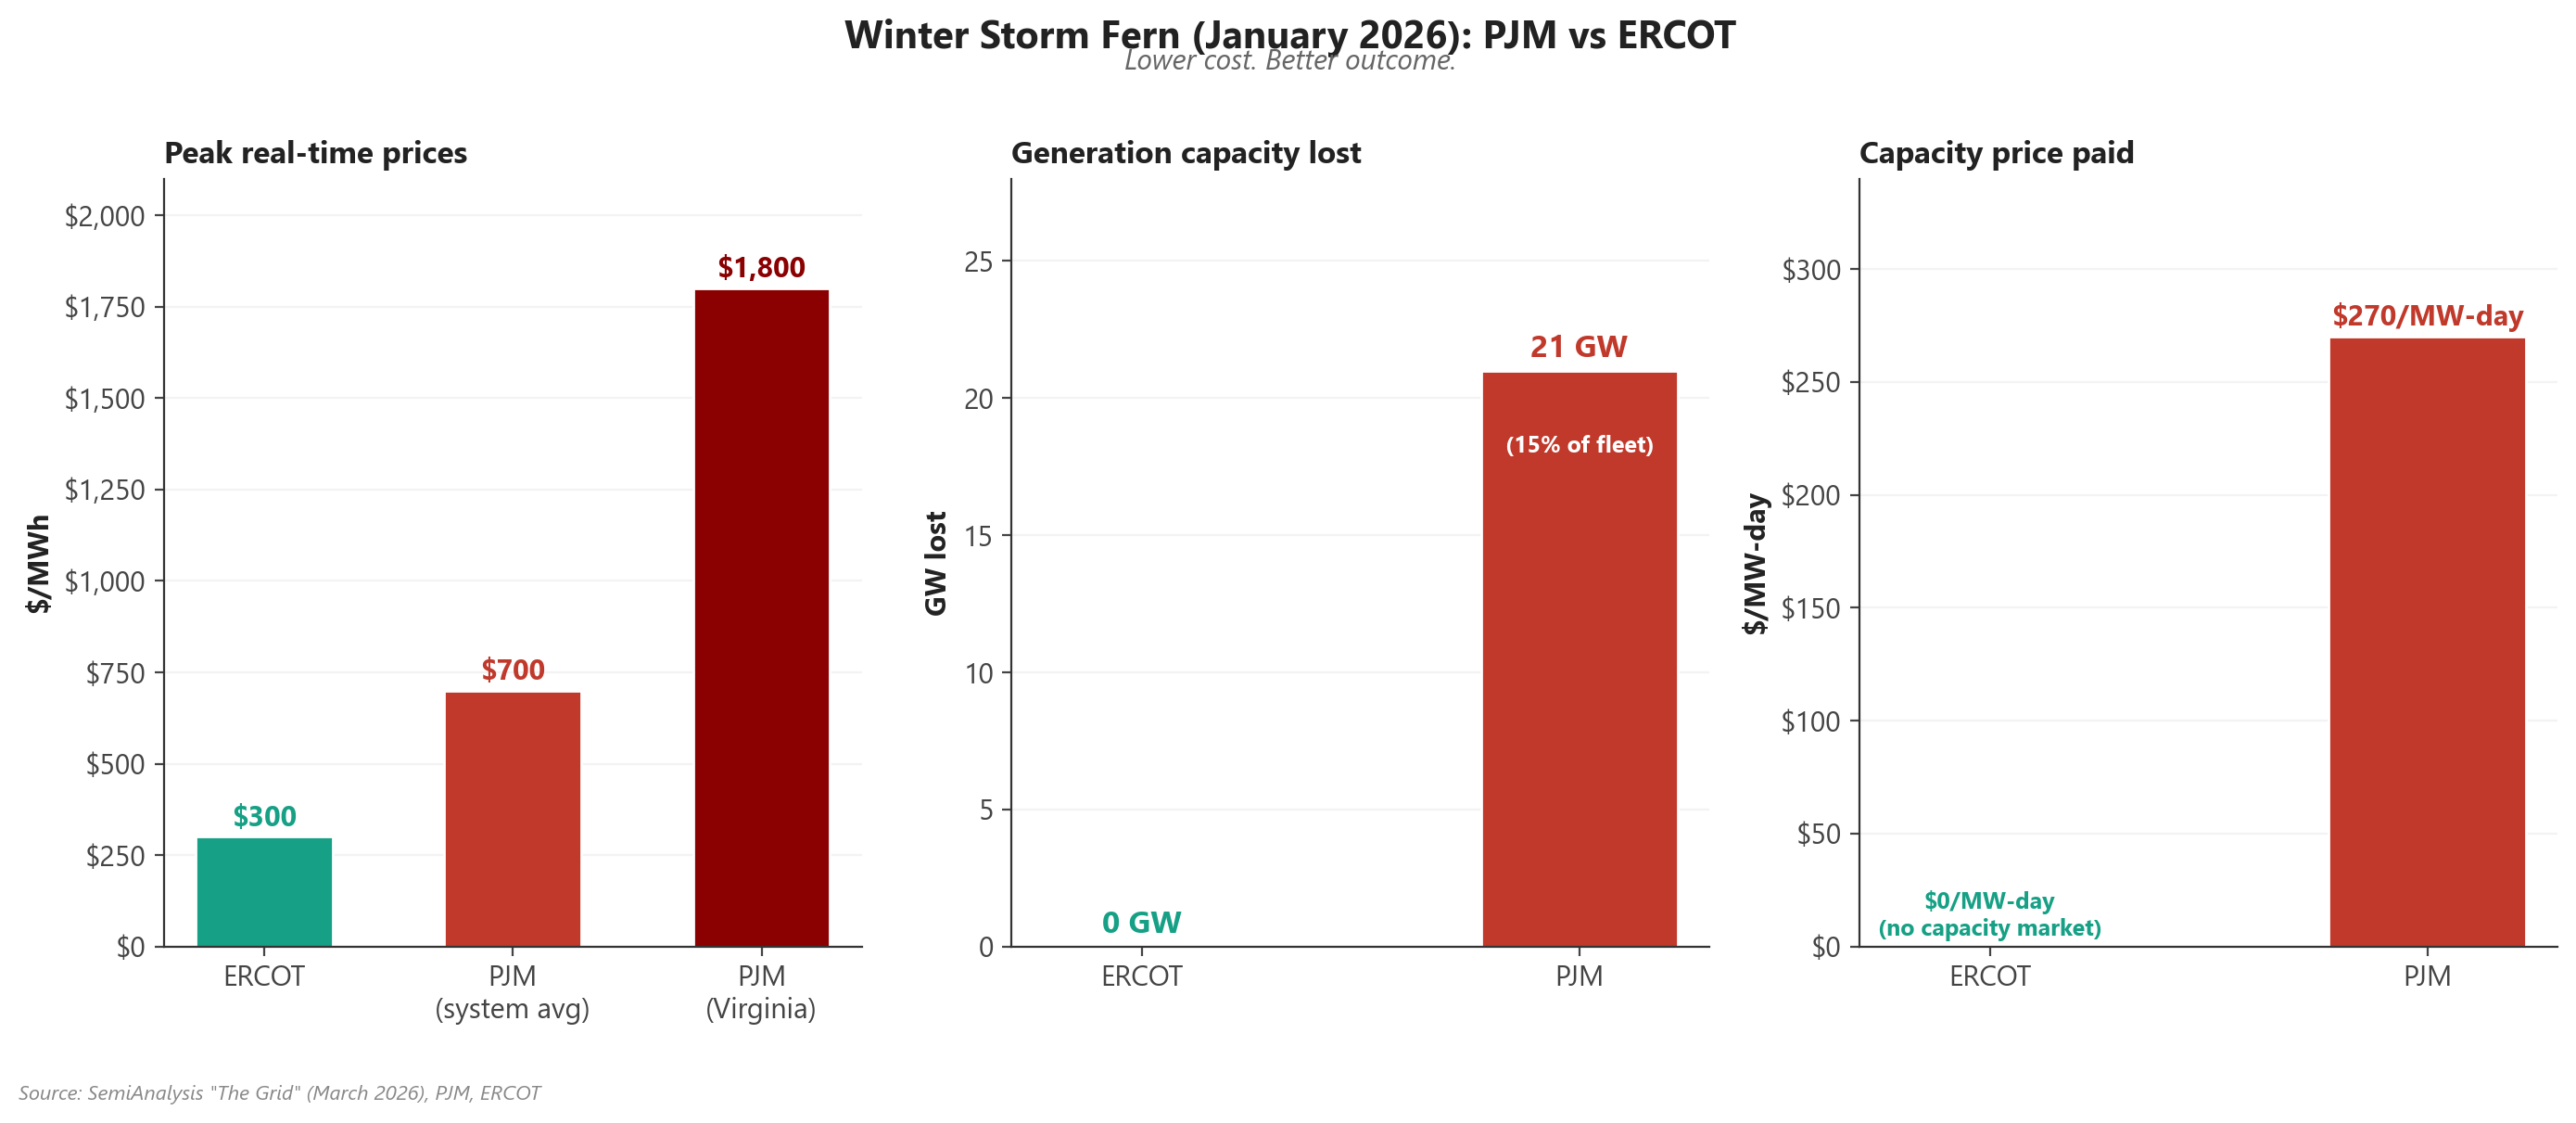
Lower cost, better outcome. ERCOT’s market discipline delivered what PJM’s $16 billion in capacity payments could not.
Below the paywall we discuss a couple of popular IPP (power producer) stocks, why it was a popular trade in 2024, and why they’ve stopped working recently. I made a comps table for all the IPPs on their different types of capacity (nuclear, CCGT, peaker, solar, etc.), converted them into CCGT-equivalents to show who is the relative cheapest. Then we move on to more intriguing and granular discussion about the problems with the grid when it comes to powering AI. Finally, we end with the real deal. Two solutions that actually solve the grid’s constraints, essentially “overflow valves” that are a call option on AI energy demand and the stocks I actually own for each.